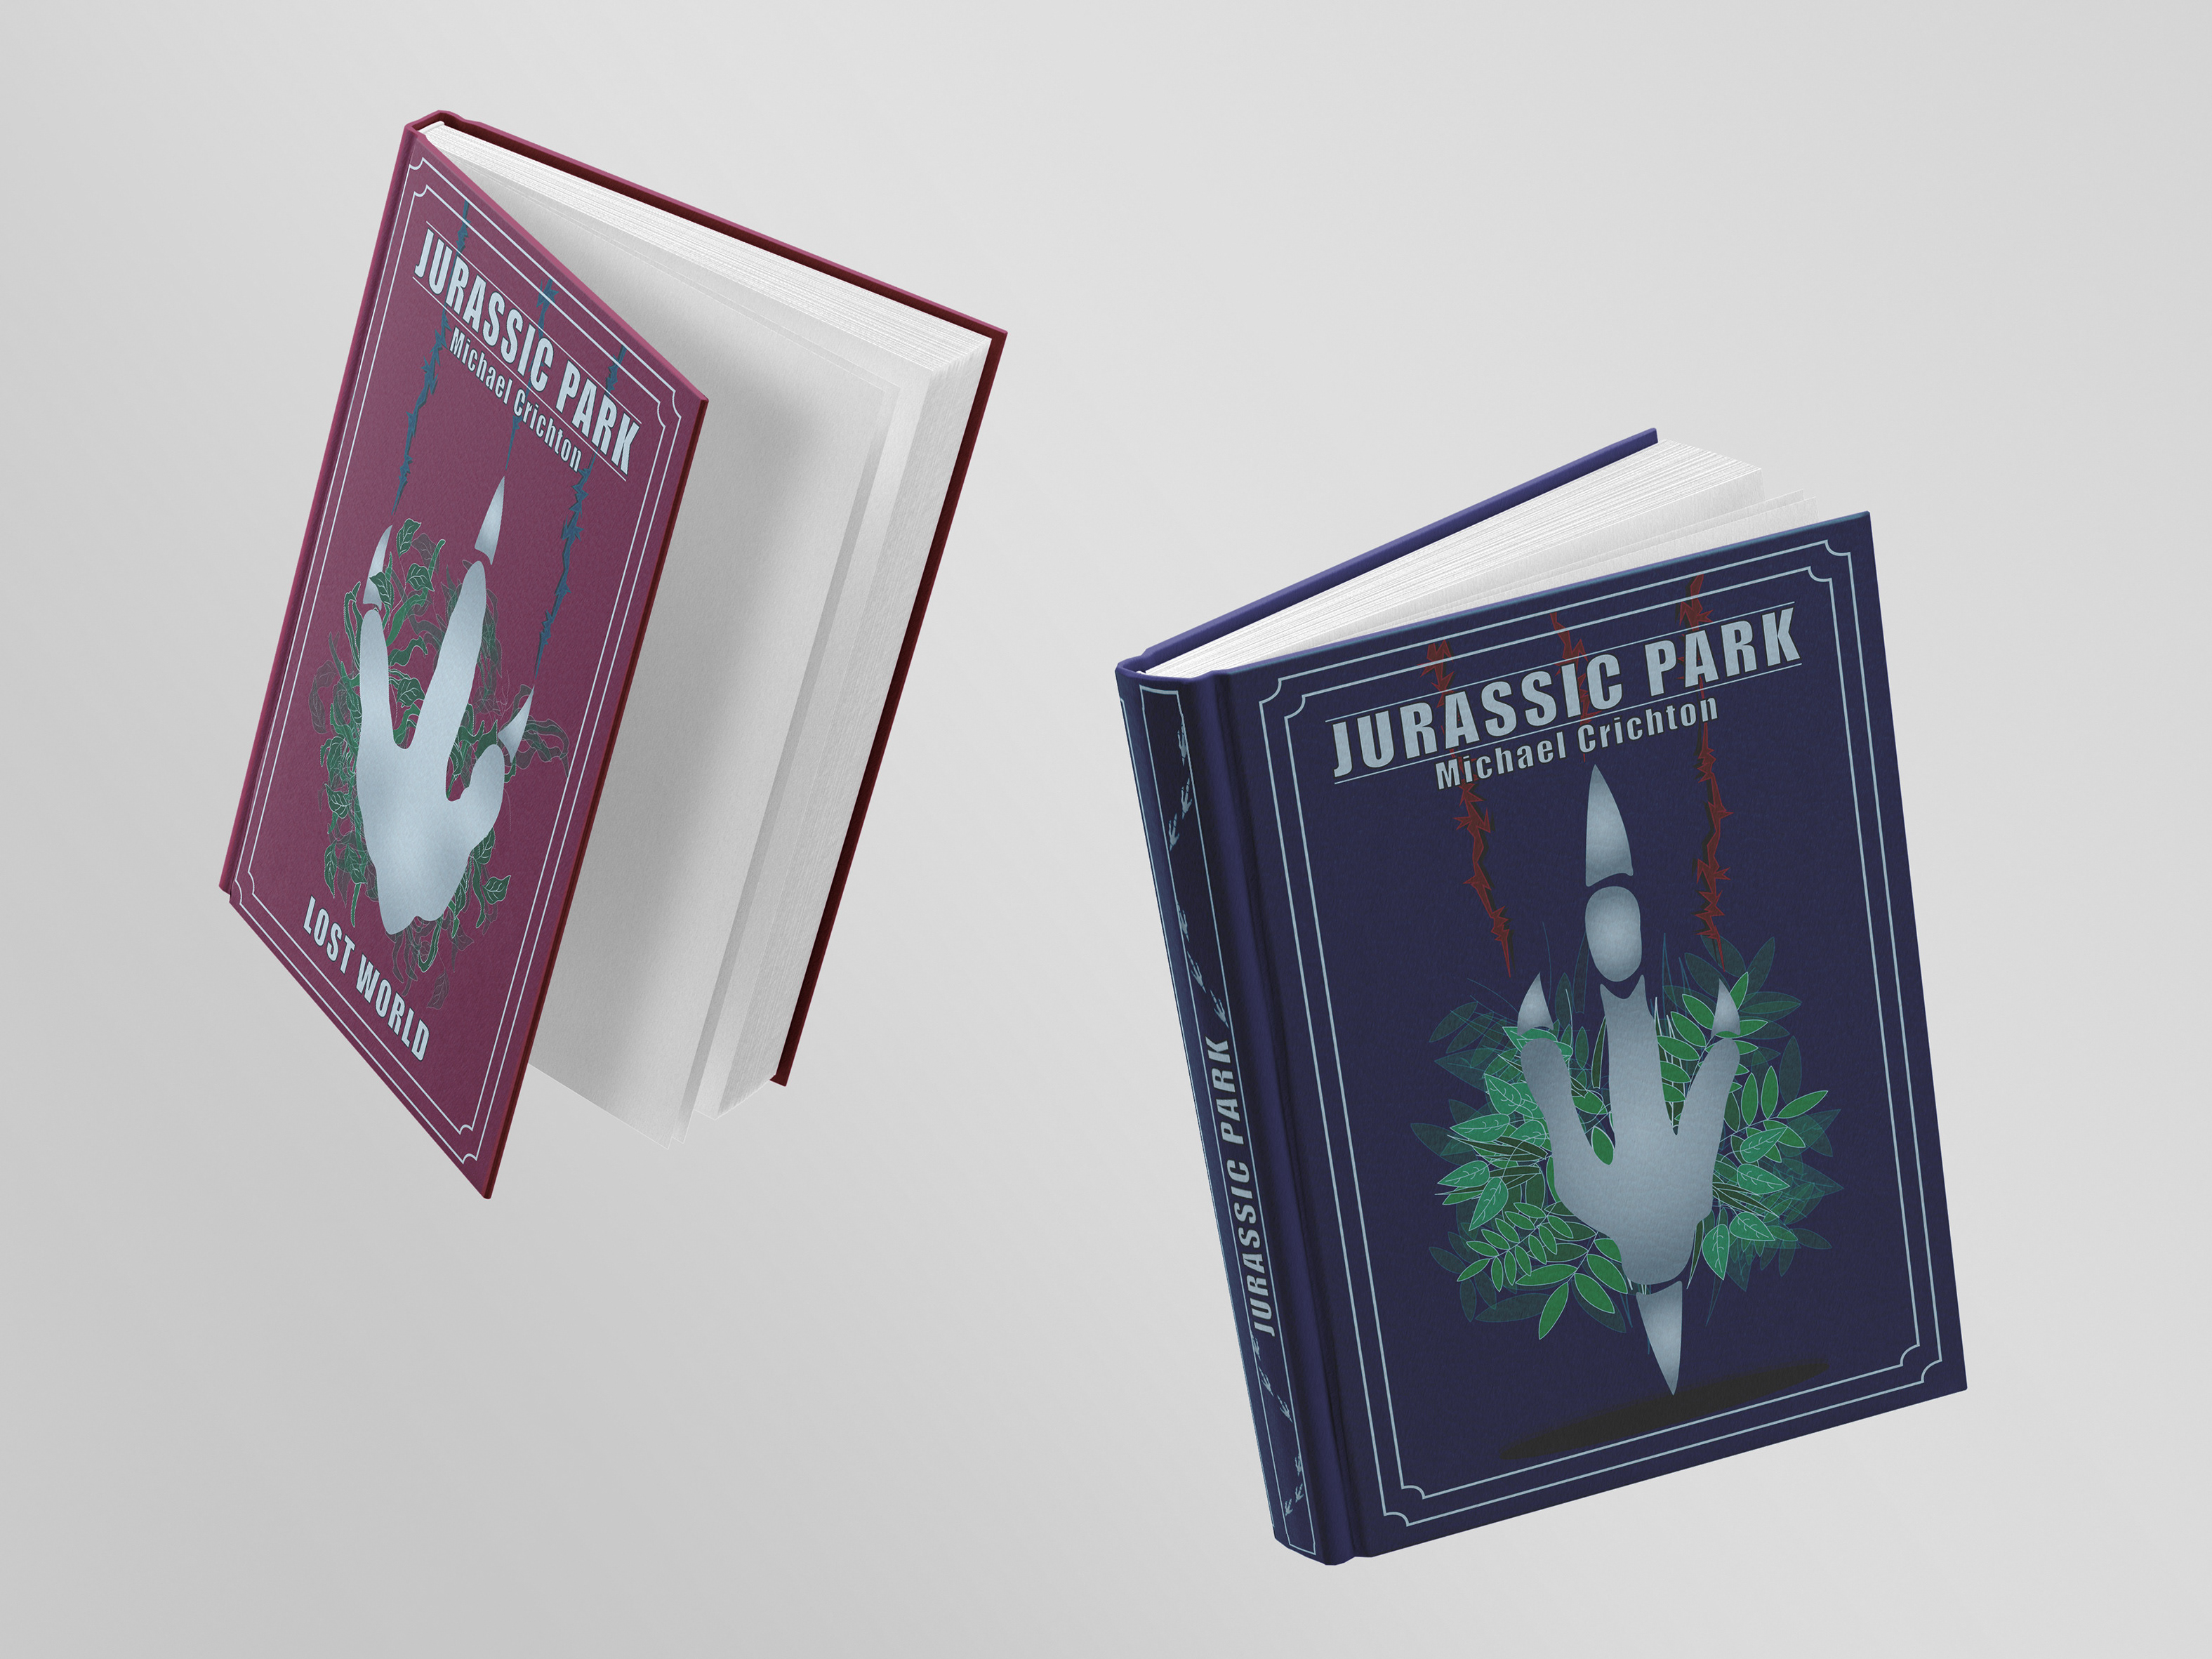
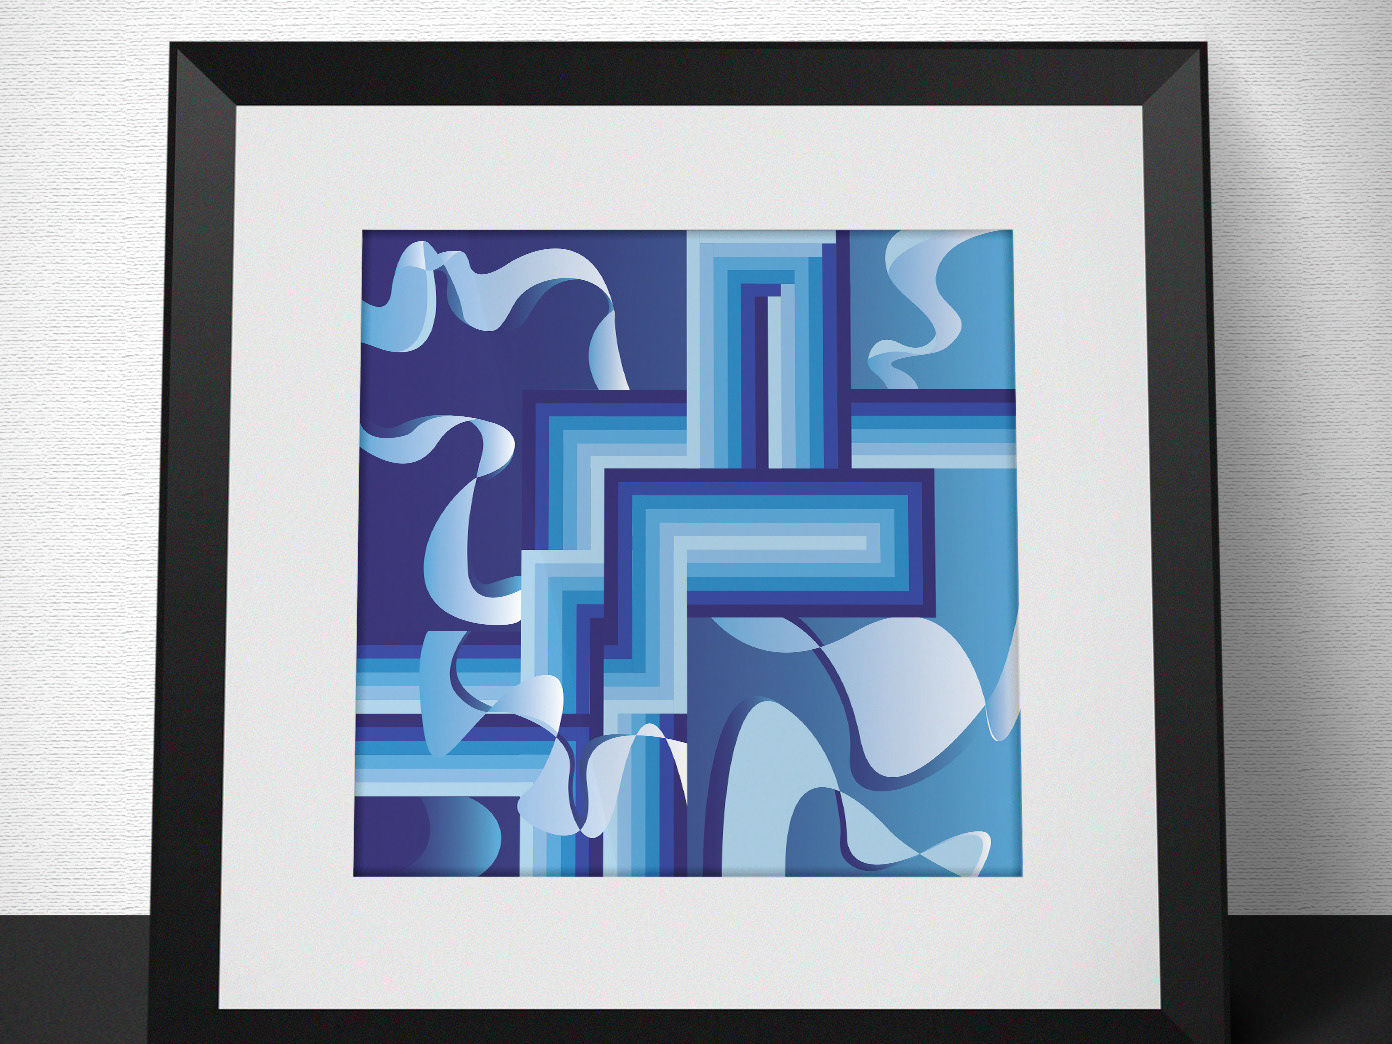
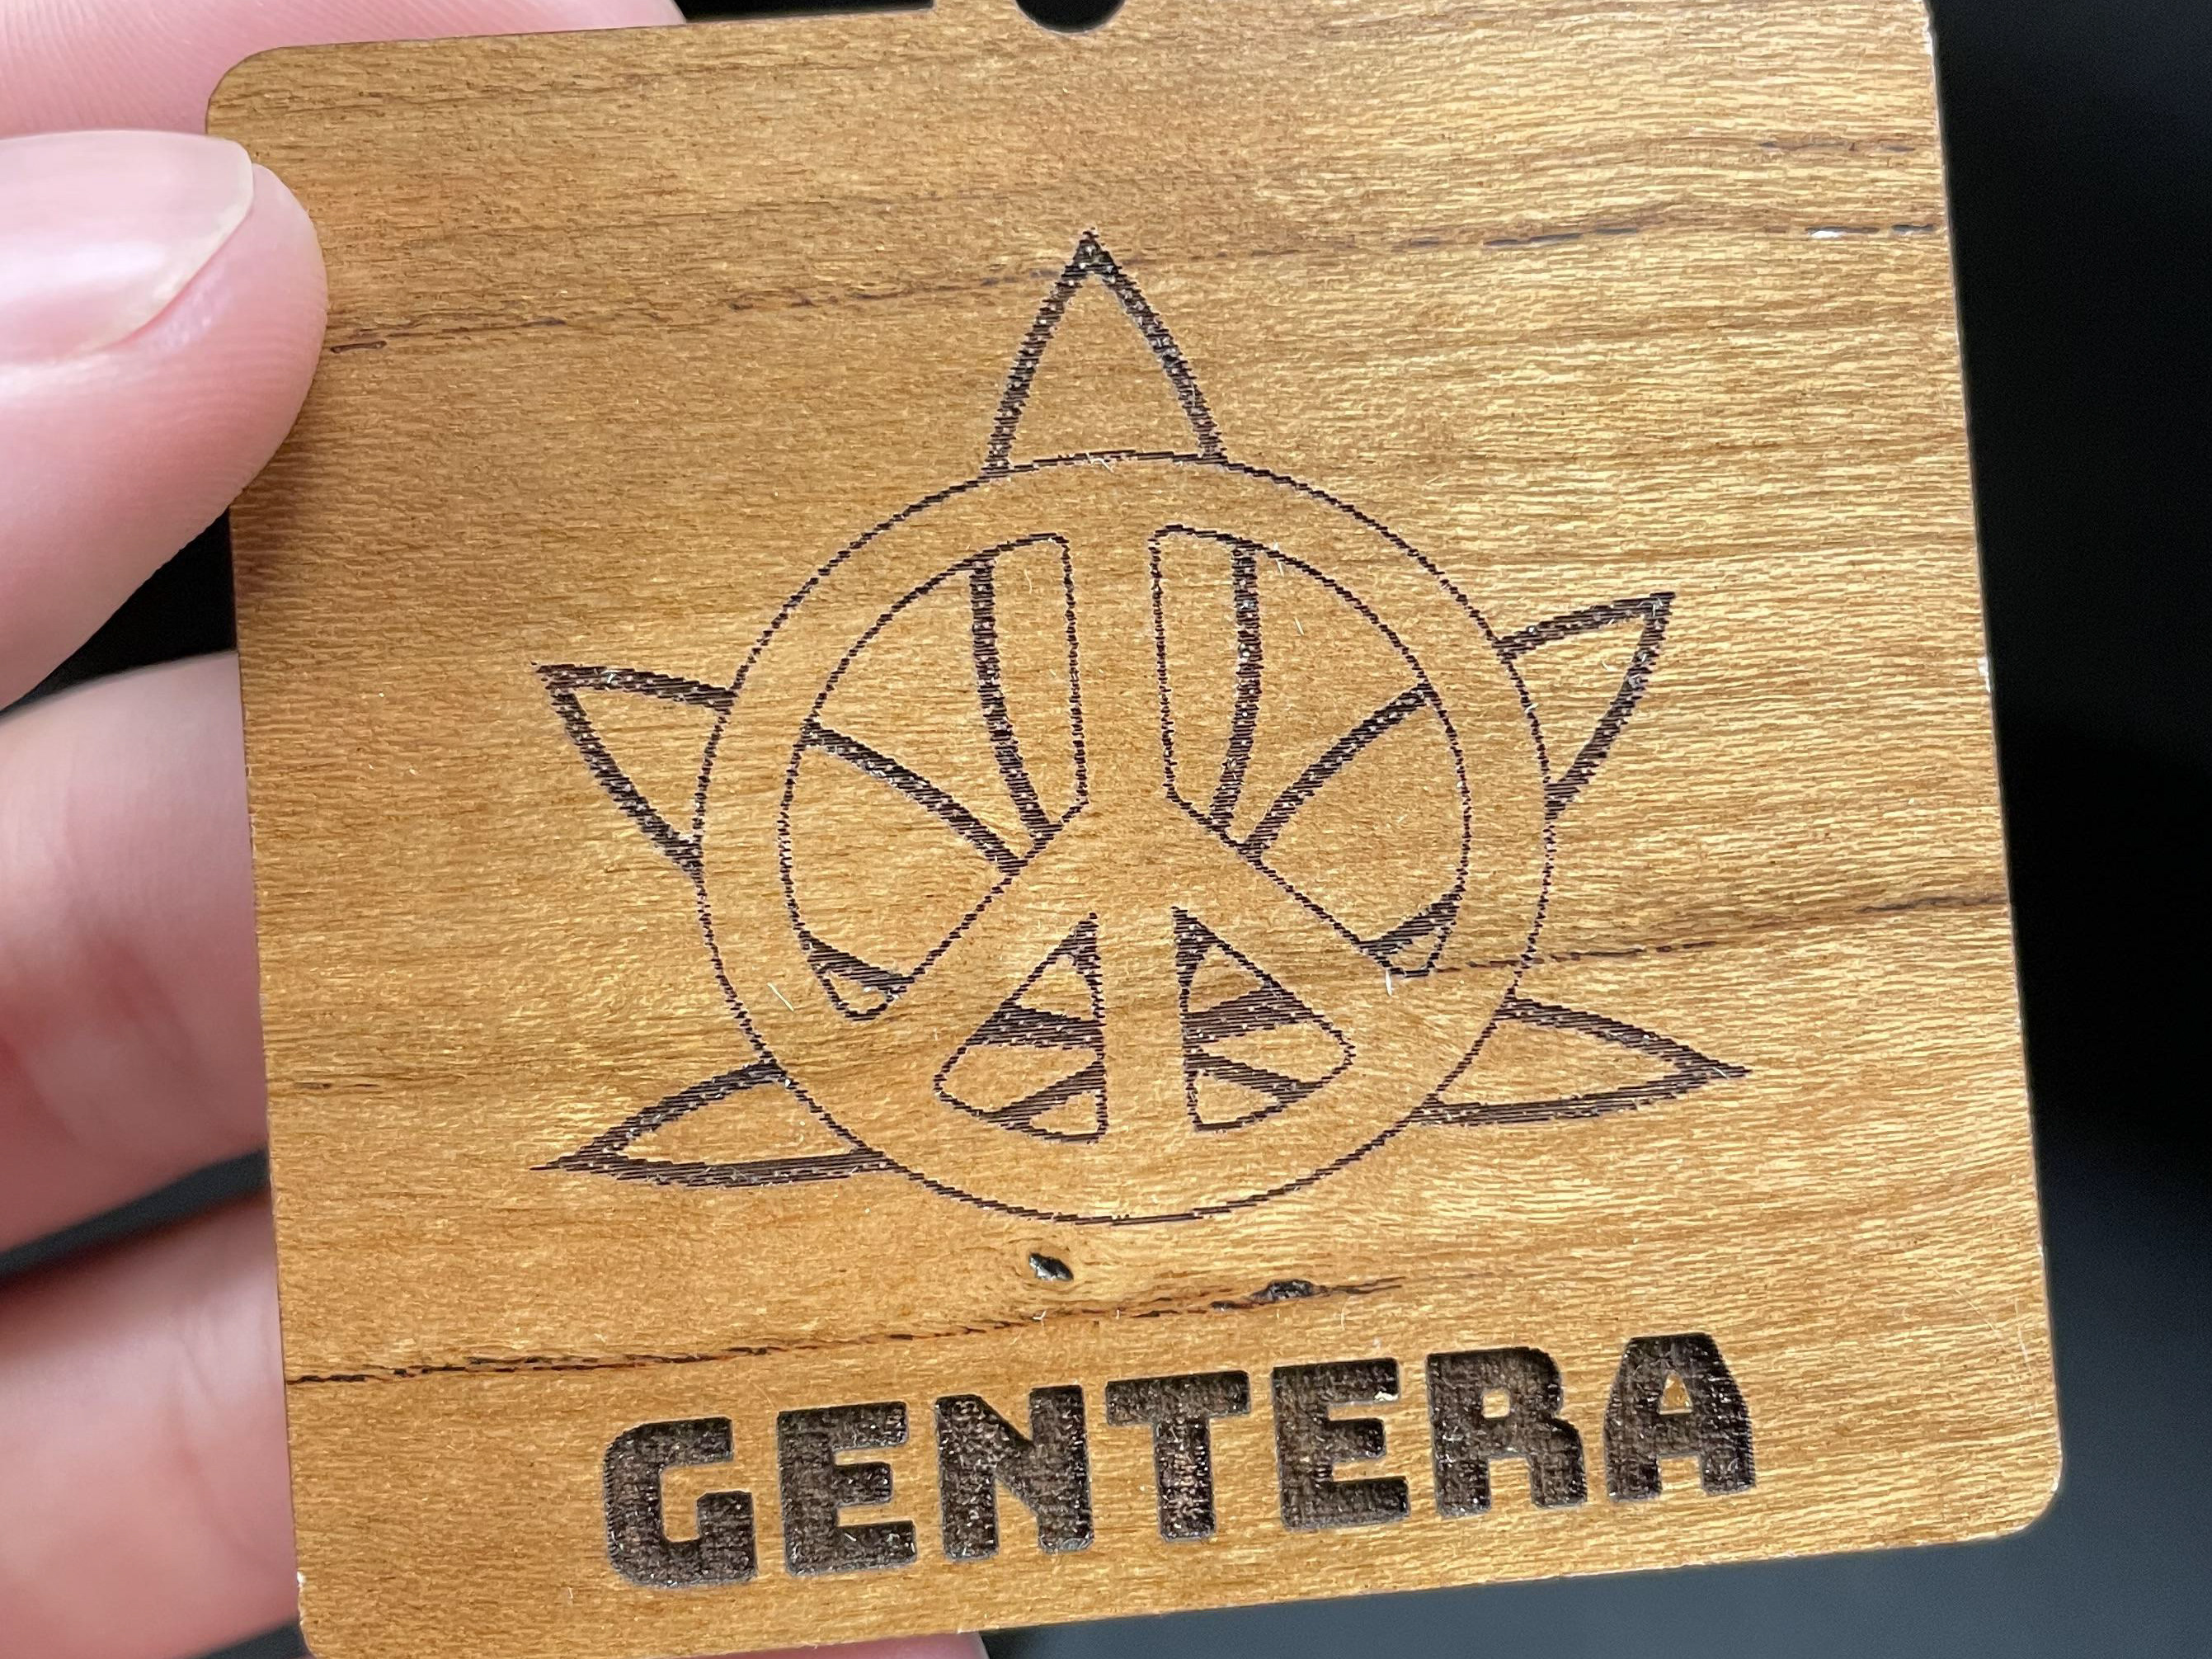
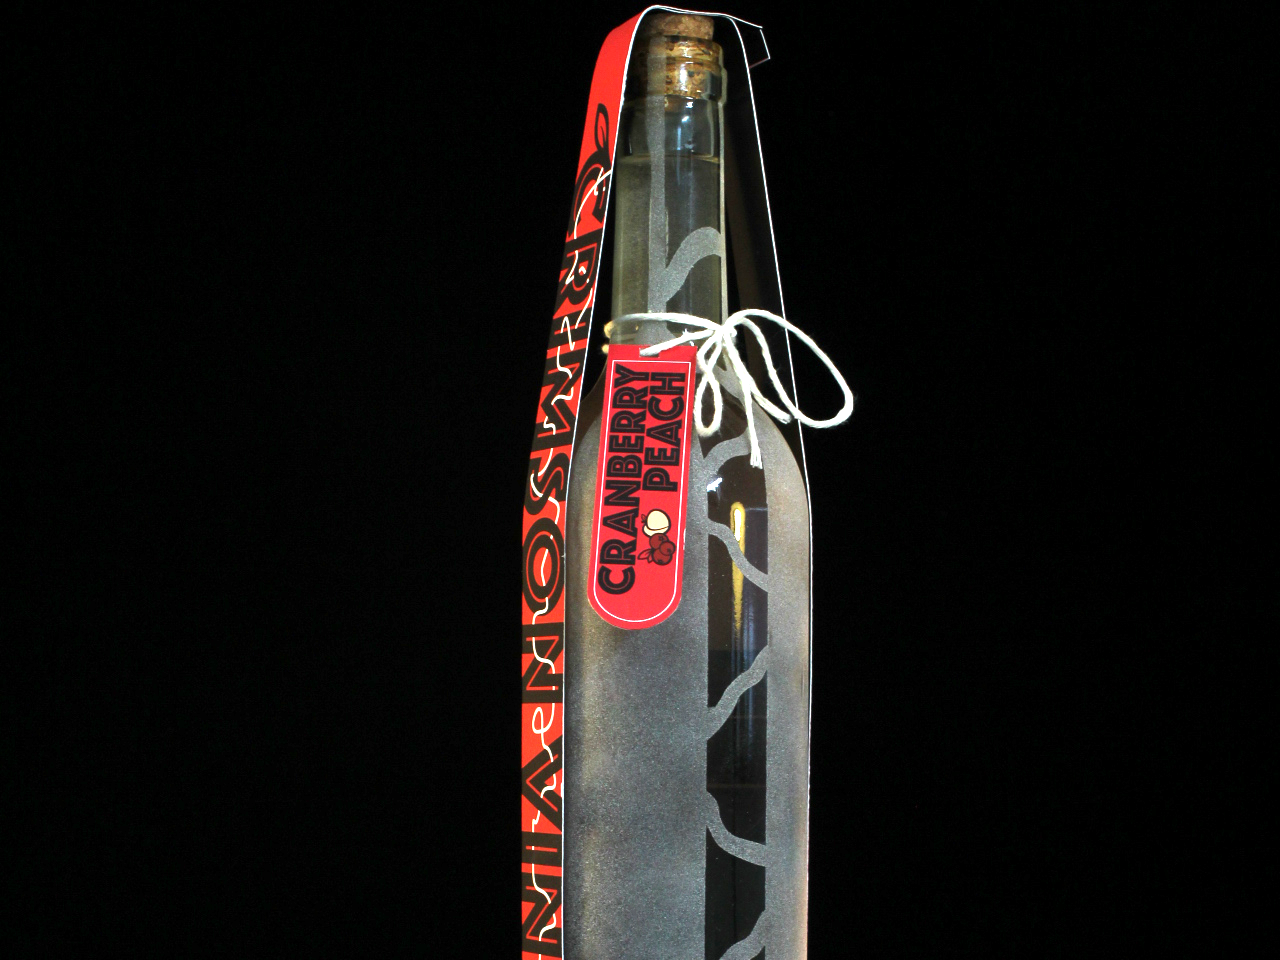
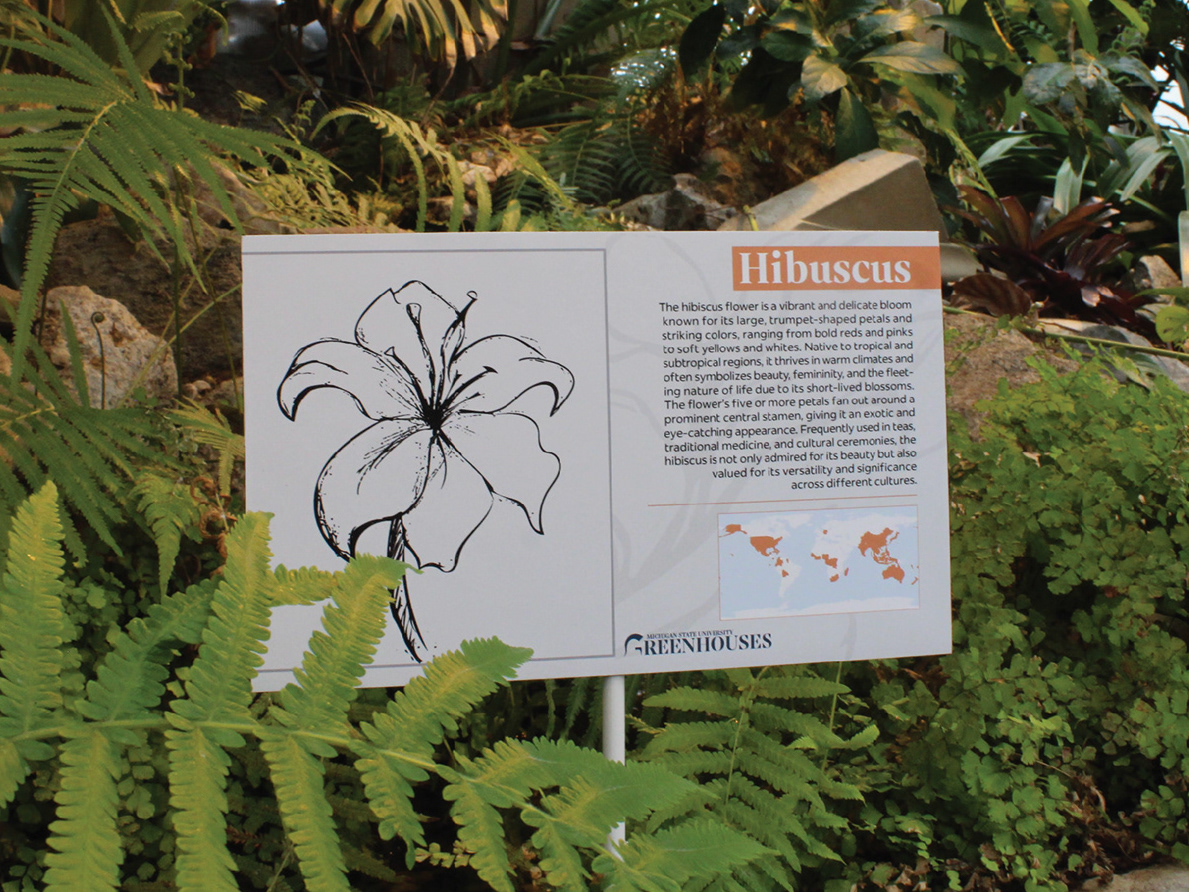
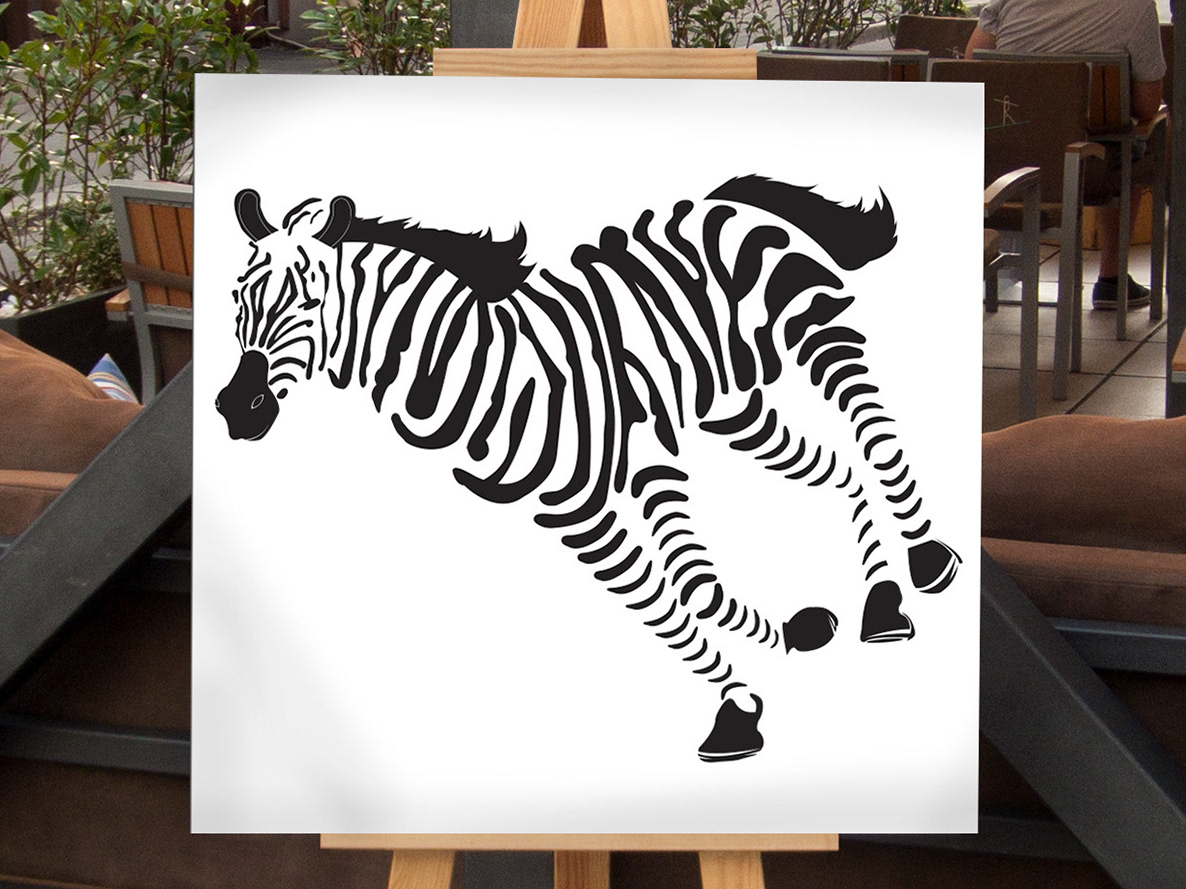
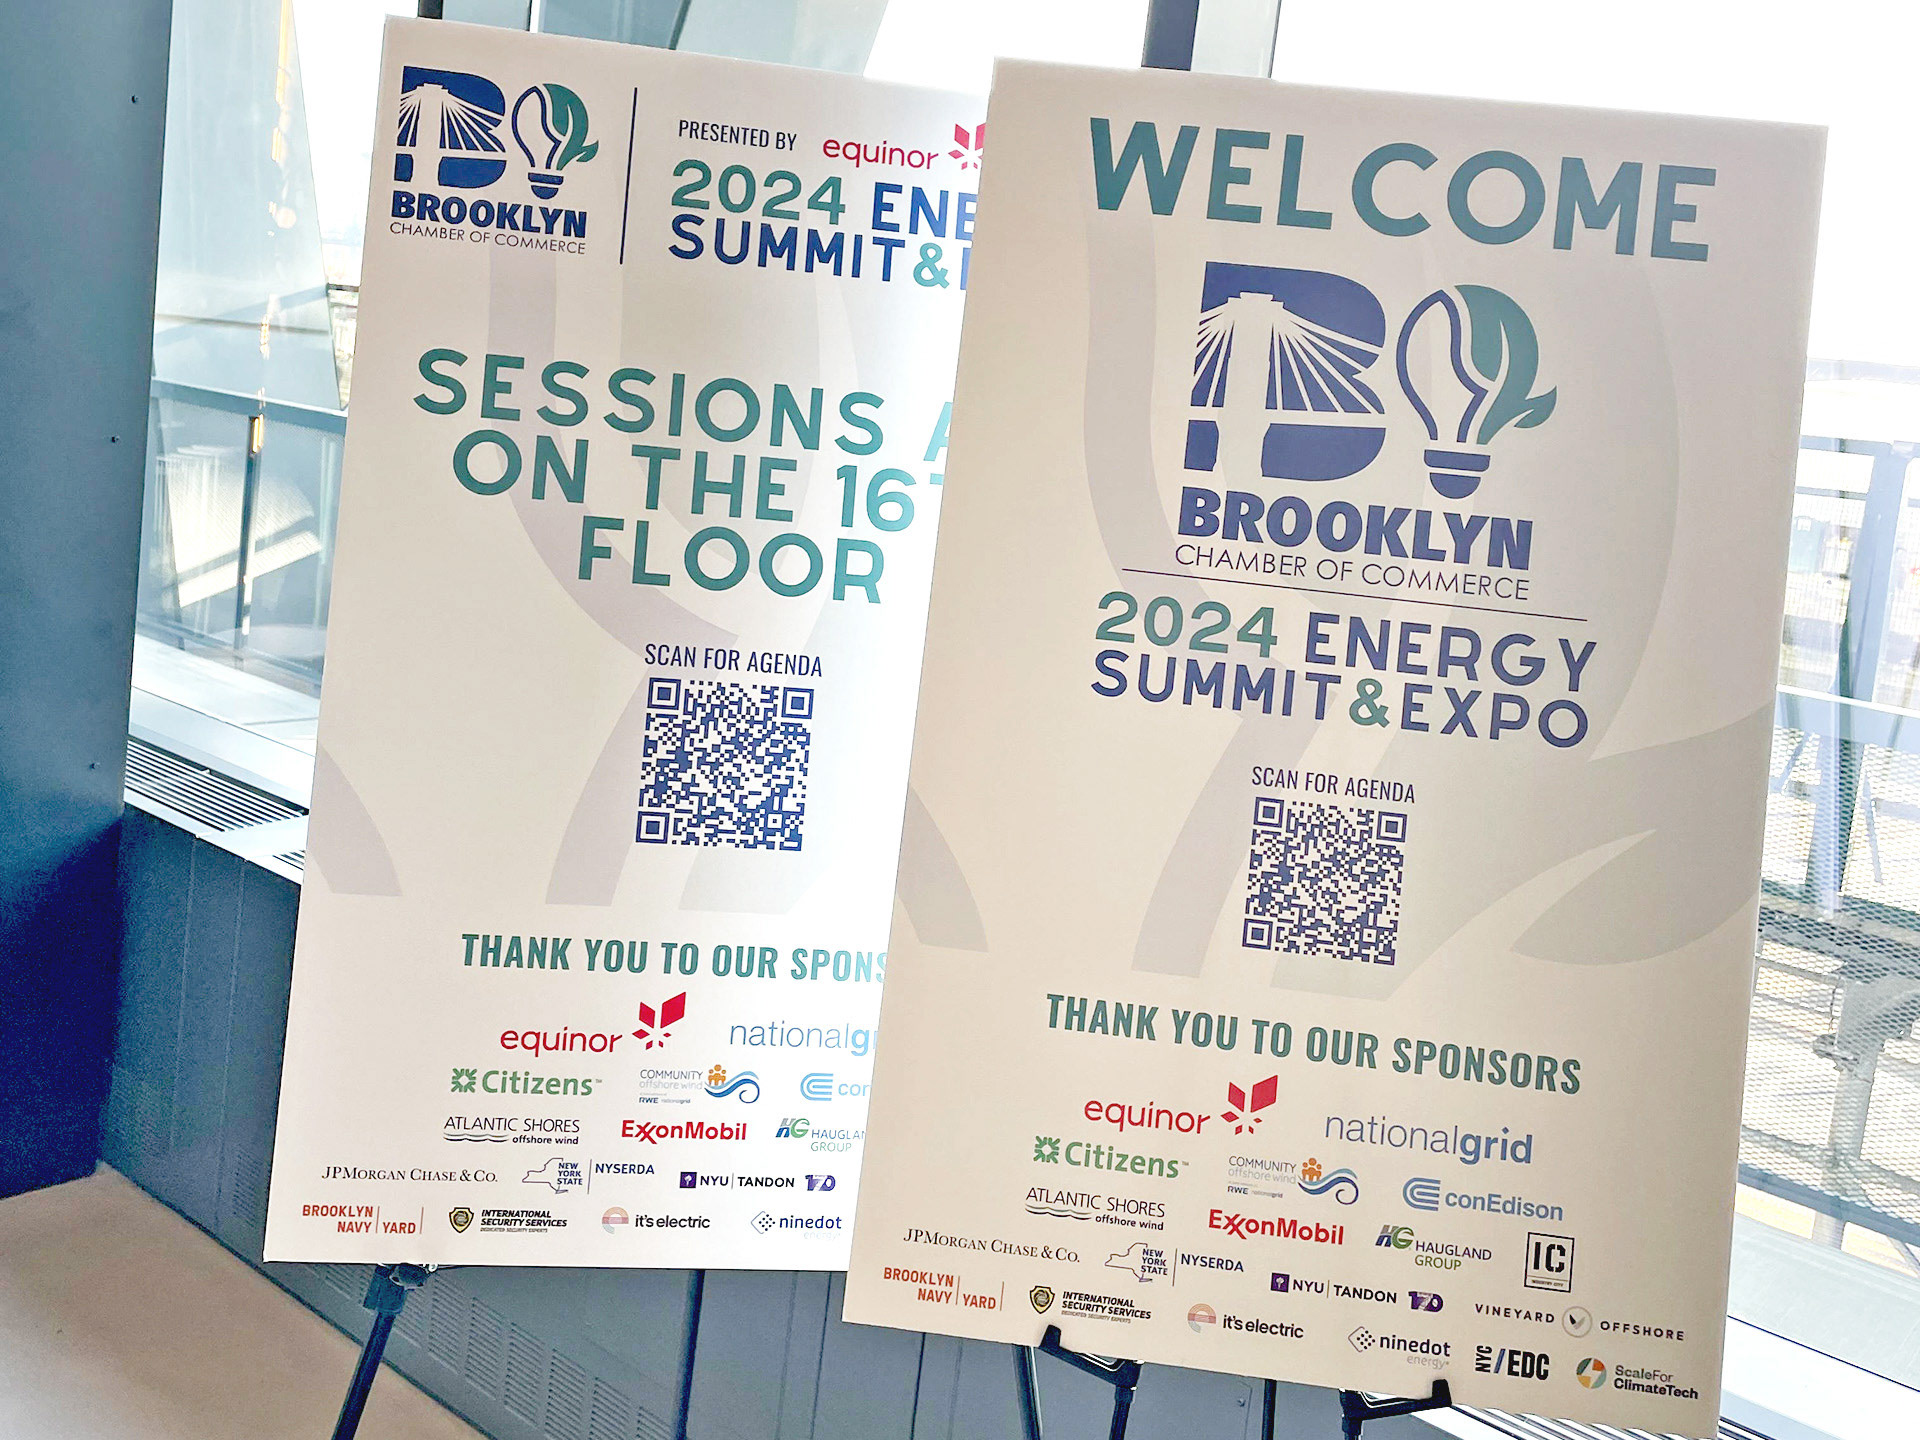
During the spring semester of my senior year of college I did an internship at the Michigan State University Design Center. The MSU Design Center works with both on-campus and external clients and aims to give interns real world design experiences. For each project, the client would present their concept to the whole class and each intern would come up with their own personal solution. The interns would then help each other refine their ideas over the course of several weeks and finally come together to vote on the strongest solutions to present to the client. By the end of the semester, I was chosen to present to four of the five clients and honored with being chosen to print for the 2025 Graphic Design Bar Crawl t-shirt.
